I’ve been going through the IBM AI Engineering Professional Certificate course and I came across a fun, extremely relevant exercise that I thought was worth sharing.
This professional certificate includes 13 component courses, each available individually:
- Machine Learning with Python
- Introduction to Deep Learning & Neural Networks with Keras
- Deep Learning with Keras and Tensorflow
- Introduction to Neural Networks and PyTorch
- Deep Learning with PyTorch
- AI Capstone Project with Deep Learning
- Generative AI and LLMs: Architecture and Data Preparation
- Gen AI Foundational Models for NLP & Language Understanding
- Generative AI Language Modeling with Transformers
- Generative AI Engineering and Fine-Tuning Transformers
- Generative AI Advanced Fine-Tuning for LLMs
- Fundamentals of AI Agents Using RAG and LangChain
- Project: Generative AI Applications with RAG and LangChain
I’ve just completed the fourth one, and as part of the final course project, I was provided with League of Legends play data to build a match predictor.
Set Up
Here’s my requirements.txt:
graphviz==0.20.3
gym==0.26.2
ipykernel==6.29.5
keras==3.8.0
keras-tuner==1.4.7
matplotlib==3.9.4
pandas==2.2.3
pydot==3.0.4
scikit-learn==1.6.0
setuptools==75.7.0
tensorflow==2.17.0
tqdm==4.67.1
torch==2.7.0
wheel==0.45.1
It contains additional packages I’ve needed throughout the courses so feel free to remove what’s not needed and set up a virtual environment:
mkdir lol && cd lol
python3 -m venv .venv
source ./.venv/bin/activate
pip install -r requirements.txt
Dataset
Assuming the dataset link remains stable, run:
import pandas as pd

data = pd.read_csv("https://cf-courses-data.s3.us.cloud-object-storage.appdomain.cloud/rk7VDaPjMp1h5VXS-cUyMg/league-of-legends-data-large.csv")
data.head()
Here’s what the data looks like:
| win | kills | deaths | assists | gold_earned | cs | wards_placed | wards_killed | damage_dealt |
|---|---|---|---|---|---|---|---|---|
| 0 | 16 | 19 | 6 | 17088 | 231 | 11 | 7 | 15367 |
| 1 | 8 | 5 | 8 | 14865 | 259 | 10 | 2 | 38332 |
| 0 | 0 | 11 | 17 | 15919 | 169 | 14 | 5 | 24642 |
| 0 | 19 | 1 | 11 | 11534 | 264 | 14 | 3 | 15789 |
| 0 | 12 | 6 | 7 | 18926 | 124 | 15 | 7 | 40268 |
So our target is the win variable and the rest are the predictors. Since this
is a binary prediction, logistic regression is a suitable modelling technique.
Training
Prepare training and test sets:
from sklearn.model_selection import train_test_split
from sklearn.preprocessing import StandardScaler
import torch

X = data.drop("win", axis=1)
y = data["win"]

X_train, X_test, y_train, y_test = train_test_split(
    X, y, test_size=0.2, random_state=42,
)

scaler = StandardScaler()
X_train_scaled = scaler.fit_transform(X_train)
X_test_scaled = scaler.transform(X_test)

X_train_tensor = torch.tensor(X_train_scaled, dtype=torch.float32)
X_test_tensor = torch.tensor(X_test_scaled, dtype=torch.float32)
y_train_tensor = torch.tensor(y_train.values, dtype=torch.float32).view(-1, 1)
y_test_tensor = torch.tensor(y_test.values, dtype=torch.float32).view(-1,  1)
Train the model for 1000 epochs:
import torch.nn as nn

class LogisticRegressionModel(nn.Module):
    def __init__(self, n_inputs):
        super(LogisticRegressionModel, self).__init__()
        self.linear = nn.Linear(n_inputs, 1)
        self.sigmoid = nn.Sigmoid()

    def forward(self, x):
        y_hat = self.sigmoid(self.linear(x))
        return y_hat


input_dim = X_train.shape[1]
model = LogisticRegressionModel(input_dim)

criterion = nn.BCELoss()
learning_rate = 0.01
optimizer = torch.optim.SGD(model.parameters(), lr=learning_rate)

num_epochs = 1000
for epoch in range(1, num_epochs + 1):
    model.train()
    optimizer.zero_grad()

    outputs = model(X_train_tensor)
    loss = criterion(outputs, y_train_tensor)

    loss.backward()
    optimizer.step()

    if epoch % 100 == 0:
        print(f"Epoch [{epoch}/{num_epochs}], Loss: {loss.item():.4f}")
Evaluation
Evaluate the model:
model.eval()
with torch.no_grad():
    train_preds = model(X_train_tensor)
    test_preds = model(X_test_tensor)

    train_pred_labels = (train_preds >= 0.5).float()
    test_pred_labels = (test_preds >= 0.5).float()

    train_accuracy = (train_pred_labels == y_train_tensor).sum().item() / y_train_tensor.size(0)
    test_accuracy = (test_pred_labels == y_test_tensor).sum().item() / y_test_tensor.size(0)

    print(f"\nTraining Accuracy: {train_accuracy * 100:.2f}%")
    print(f"Testing Accuracy: {test_accuracy * 100:.2f}%")
And it gives us:
Training Accuracy: 54.37%
Testing Accuracy: 51.50%
Here’s a snippet for a classification report:
from sklearn.metrics import classification_report

print("Classification Report:\n", classification_report(y_test, test_pred_labels, target_names=['Loss', 'Win']))
The classification report output:
Classification Report:
               precision    recall  f1-score   support

        Loss       0.49      0.47      0.48        95
         Win       0.54      0.55      0.54       105

    accuracy                           0.52       200
   macro avg       0.51      0.51      0.51       200
weighted avg       0.51      0.52      0.51       200
Here’s a snippet for plotting ROC curve:
from sklearn.metrics import roc_curve, auc

fpr, tpr, thresholds = roc_curve(y_test, test_preds)
roc_auc = auc(fpr, tpr)

plt.figure()
plt.plot(fpr, tpr, color='darkorange', lw=2, label=f'ROC curve (area = {roc_auc:.2f})')
plt.plot([0, 1], [0, 1], color='navy', lw=2, linestyle='--')
plt.xlim([0.0, 1.0])
plt.ylim([0.0, 1.05])
plt.xlabel('False Positive Rate')
plt.ylabel('True Positive Rate')
plt.title('Receiver Operating Characteristic (ROC)')
plt.legend(loc="lower right")
plt.savefig("lol_roc.png")
plt.show()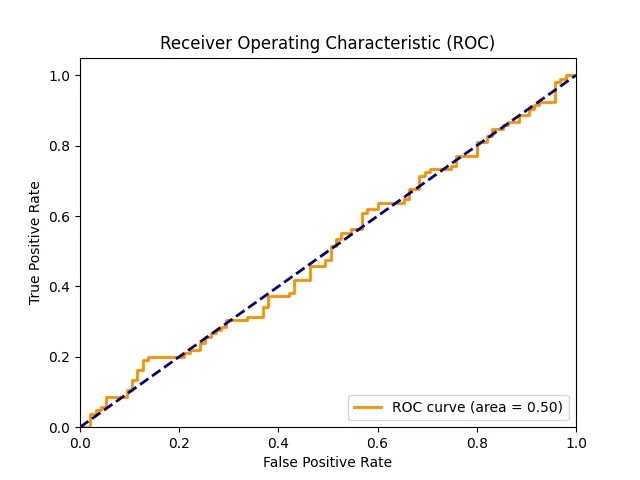
What the Model Learned
Nothing. There isn’t a meaningful pattern to be learned. The model is
essentially a coin flip 😅 The dataset needs strong features that can better
linearly separate the win variable, and more matches.
Below is the bar chart of logistic regression coefficients (interpreted as feature importance).
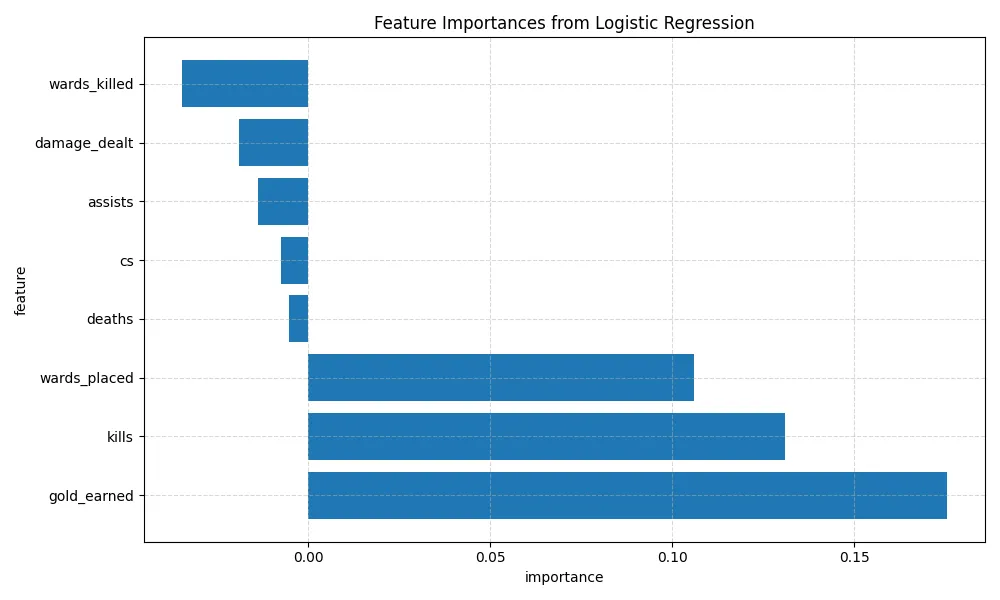
Here’s the snippet for reproducibility:
import pandas as pd
import matplotlib.pyplot as plt

weights = model.linear.weight.data.numpy().flatten()
feature_importance_df = pd.DataFrame({
    "feature": X_train.columns,
    "importance": weights,
})

feature_importance_df = feature_importance_df.sort_values(by="importance", ascending=False)

plt.figure(figsize=(10, 6))
plt.barh(feature_importance_df['feature'], feature_importance_df['importance'])
plt.xlabel('importance')
plt.ylabel('feature')
plt.title('Feature Importances from Logistic Regression')
plt.grid(True, linestyle='--', alpha=0.5)
plt.tight_layout()
plt.savefig("lol_feature_importance.png")
plt.show()
While the model didn’t generalise well or offer useful predictions, it’s still interesting that gold earned emerged as the strongest predictor for winning a match, followed by the number of kills and wards placed.
My next LoL match will be focused on farming and securing kills, and placing wards when I’m playing support 😆
After testing both logistic regression (linear) and random forests (non-linear), I found that neither model could beat random chance. This suggests the dataset, as-is, doesn’t contain enough predictive signal to determine a match’s outcome based on individual stats alone.
While the models didn’t end up performing better than chance, this was still a valuable exercise. It highlighted how critical good features and data context are to building a predictive model even more than the choice of algorithm. Not everything we try in machine learning works, and that’s okay. Sometimes the most useful outcome is learning what doesn’t work and why. Other times machine learning really is just:
def garbage_in(x):
    return garbage_in(x)
garbage_out = garbage_in("stats")
In the end, this was a great reminder that in ML, clever models can’t replace quality data, and sometimes the best insights come from failed experiments.
TL;DR
I used PyTorch to build a logistic regression model predicting LoL wins based on player stats. The model didn’t beat random guessing, highlighting the importance of good features over fancy algorithms.